Navigating the stock market can feel daunting, especially for newcomers. This guide demystifies the process, offering a clear path for beginners to understand basic concepts, develop sound investment strategies, and manage risk effectively. We’ll explore everything from fundamental principles to practical tools and resources, empowering you to make informed decisions with confidence.
From understanding different stock types and market indexes to employing strategies like dollar-cost averaging and diversification, we’ll cover the essentials. We’ll also delve into the use of stock options, the importance of research and due diligence, and how to interpret crucial market data. By the end, you’ll possess a solid foundation to begin your investment journey responsibly.
Risk Management and Diversification
Investing in the stock market offers the potential for significant returns, but it also carries inherent risks. Understanding and managing these risks is crucial for long-term success. A key strategy for mitigating risk is diversification, which involves spreading your investments across various asset classes to reduce the impact of any single investment’s poor performance.
Common Stock Market Risks
Several risks are associated with stock market investments. These include market risk (overall market downturns), company-specific risk (a particular company performing poorly), interest rate risk (changes in interest rates impacting stock prices), and inflation risk (the erosion of purchasing power due to rising prices). Understanding these risks allows investors to make informed decisions and develop appropriate risk management strategies.
For example, a sudden increase in interest rates might negatively impact growth stocks, while a period of high inflation could erode the real returns of any investment.
Diversification Strategies for Risk Mitigation
Diversification is a fundamental principle of investing. It involves spreading your investments across different asset classes, sectors, and geographies to reduce the overall risk of your portfolio. By diversifying, you’re not putting all your eggs in one basket. If one investment performs poorly, the losses might be offset by the gains from other investments in your portfolio. A well-diversified portfolio can significantly reduce volatility and potentially enhance long-term returns.
For instance, an investor might allocate funds to stocks, bonds, real estate, and commodities, ensuring that a downturn in one area doesn’t completely derail their overall investment strategy.
Asset Classes and Risk Profiles
The following table illustrates different asset classes and their associated risk profiles. It’s important to note that risk tolerance is subjective and varies among investors.
| Asset Class | Risk Profile | Potential Return | Liquidity |
|---|---|---|---|
| Stocks (Equities) | High | High | High (for publicly traded stocks) |
| Bonds (Fixed Income) | Medium | Medium | Medium to High (depending on bond type) |
| Real Estate | Medium to High | Medium to High | Low (can take time to sell) |
| Commodities (Gold, Oil, etc.) | High | Variable | Medium (depending on the commodity) |
Stock Trading Platforms and Tools

Navigating the world of stock trading requires more than just understanding market dynamics; it necessitates the right tools and platforms to execute your strategies effectively. Choosing the appropriate platform and familiarizing yourself with essential tools are crucial steps for beginners to ensure a smooth and efficient trading experience. This section will guide you through selecting a brokerage and utilizing helpful resources.Choosing the right online brokerage is a critical first step for any beginner investor.
Different platforms cater to varying needs and levels of experience, offering diverse features and fee structures. Understanding these differences will help you make an informed decision aligned with your trading style and financial goals.
Online Brokerage Platforms for Beginners
Several online brokerage platforms cater specifically to beginners, offering user-friendly interfaces and educational resources. Key factors to consider when comparing platforms include account minimums, commission fees, trading tools, research capabilities, and customer support. Some platforms offer excellent educational materials, including tutorials, webinars, and simulated trading environments, which are invaluable for novice traders. Others may focus on simplicity and ease of use, minimizing the learning curve.
The best platform for you will depend on your individual preferences and trading style.
Essential Tools and Resources for Successful Stock Trading
Beyond the brokerage platform itself, several tools and resources can significantly enhance your trading experience. These tools can help you research stocks, analyze market trends, manage risk, and track your portfolio’s performance. Investing time in learning to use these resources effectively will improve your decision-making and overall success in the market.
- Charting Software: Provides visual representations of price movements, allowing you to identify trends and patterns. Many platforms offer built-in charting tools, or you can use standalone software like TradingView.
- Financial News Sources: Access to reliable and up-to-date news is crucial for staying informed about market events and their potential impact on your investments. Reputable sources provide unbiased information, allowing for informed decision-making.
- Portfolio Tracking Software: Helps monitor your investment performance, track gains and losses, and manage your overall portfolio effectively. Many brokerage platforms offer this functionality, but third-party options also exist.
- Screeners and Stock Research Tools: These tools allow you to filter stocks based on specific criteria, such as market capitalization, price-to-earnings ratio, or dividend yield, enabling efficient identification of potential investment opportunities.
The Importance of Reliable Financial News Sources
Utilizing credible financial news sources is paramount for successful stock trading. Reliable sources provide unbiased information, analysis, and insights, helping you make informed investment decisions. Conversely, relying on unreliable sources can lead to poor investment choices and potential losses. It’s crucial to discern between credible journalism and opinion pieces or manipulative information. Examples of reputable sources include the Wall Street Journal, Bloomberg, Reuters, and the Financial Times.
These sources employ fact-checking and journalistic integrity, reducing the risk of misinformation.
Comparison of Popular Trading Platforms
The following table summarizes the features and fees of some popular online brokerage platforms. Note that fees and features can change, so always check the most current information directly with the provider.
| Platform | Commission Fees (example) | Account Minimum | Key Features |
|---|---|---|---|
| Fidelity | $0 for online stock trades | $0 | Research tools, educational resources, fractional shares |
| Charles Schwab | $0 for online stock trades | $0 | Robust research platform, strong customer support, international trading |
| Interactive Brokers | Variable, competitive pricing | Varies depending on account type | Advanced trading tools, margin accounts, options trading |
| Robinhood | $0 for online stock trades | $0 | Simple interface, commission-free trading, limited research tools |
The Role of Research and Due Diligence
Investing in the stock market without thorough research is akin to sailing without a map – you might reach your destination, but the journey will be far riskier and less efficient. Understanding a company’s fundamentals and its position within the market is crucial to making informed investment decisions and mitigating potential losses. Due diligence is the process of verifying information and assessing the viability of an investment before committing your capital.Thorough research allows investors to make informed decisions, minimizing risk and maximizing potential returns.
It involves evaluating a company’s financial health, competitive landscape, management team, and future prospects. This process helps to identify undervalued companies with strong growth potential, while avoiding those with inherent risks. Ignoring this crucial step can lead to significant financial losses.
Analyzing a Company’s Financial Statements
Analyzing a company’s financial statements – primarily the balance sheet, income statement, and cash flow statement – is a cornerstone of due diligence. These statements provide a comprehensive picture of a company’s financial health, revealing its profitability, liquidity, and solvency. Different ratios derived from these statements offer valuable insights. For example, the debt-to-equity ratio indicates a company’s leverage, while the current ratio assesses its ability to meet short-term obligations.
Analyzing trends over several years provides a more complete understanding than looking at a single snapshot. Comparing these ratios to industry averages helps determine a company’s relative performance.
Reliable Sources for Company Information and Financial News
Accessing reliable information is paramount for effective research. Several sources provide accurate and timely data. The company’s own investor relations website often contains annual reports, quarterly earnings releases, and presentations. The Securities and Exchange Commission (SEC) website (sec.gov in the US) provides filings like 10-K (annual reports) and 10-Q (quarterly reports), offering a transparent view of a company’s financial activities.
Reputable financial news outlets, such as the Wall Street Journal, Bloomberg, and Reuters, provide in-depth analysis and market commentary, although it’s important to critically evaluate the information presented, considering potential biases. Finally, financial databases like Bloomberg Terminal (subscription-based) offer comprehensive data and analytical tools for in-depth research.
Performing Due Diligence: A Step-by-Step Guide
Effective due diligence requires a systematic approach. First, identify potential investment opportunities based on your investment goals and risk tolerance. Then, gather information from the sources mentioned above, focusing on the company’s financial statements, industry position, competitive landscape, and management team. Next, analyze the gathered data, calculating key financial ratios and comparing them to industry benchmarks. This comparative analysis helps determine the company’s relative strength and potential for growth.
Assess the company’s risks, considering factors such as regulatory changes, economic conditions, and competition. Finally, based on your analysis, make an informed investment decision, considering your risk tolerance and investment goals. Remember, this process is iterative; ongoing monitoring and reassessment are crucial.
Stock Market Terminology
Understanding the language of the stock market is crucial for successful investing. Many terms can seem confusing at first, but with a little study, you’ll be navigating financial news and discussions with confidence. This glossary provides definitions for some of the most common terms you’ll encounter.
Common Stock Market Terms
A strong understanding of fundamental stock market terminology is essential for navigating the world of investing. The following glossary provides clear definitions for commonly used terms, enabling you to confidently interpret market information and make informed decisions.
- Bear Market: A bear market is a period of sustained decline in the stock market, typically defined as a 20% or more drop from a recent peak. During a bear market, investor sentiment is pessimistic, and prices generally trend downward. The 2008 financial crisis is a prime example of a significant bear market.
- Bid Price: The highest price a buyer is willing to pay for a security at a given time. This is the price at which you can sell your shares.
- Blue-Chip Stock: Stocks of large, well-established, and financially sound companies with a history of consistent dividends and stable growth. These companies are often considered less risky investments.
- Bull Market: A bull market is a period of sustained growth in the stock market, characterized by rising prices and optimistic investor sentiment. The period from 2009 to 2020, following the 2008 crisis, is frequently cited as a prolonged bull market.
- Dividend: A portion of a company’s profits that is distributed to its shareholders. Companies pay dividends to reward investors and demonstrate financial health. Dividend payments can be regular or irregular, and their amount varies depending on the company’s performance.
- Growth Stock: A stock from a company expected to grow at above-average rates. These companies often reinvest their profits back into the business rather than paying large dividends, focusing on expansion and innovation. Examples include many technology companies in their early stages of development.
- Market Capitalization: The total market value of a company’s outstanding shares. It’s calculated by multiplying the current share price by the number of outstanding shares. A company with a large market capitalization is considered a large-cap stock, while a smaller one is a small-cap stock.
- PE Ratio (Price-to-Earnings Ratio): A valuation metric that compares a company’s stock price to its earnings per share (EPS). It helps determine if a stock is overvalued or undervalued relative to its earnings. A high P/E ratio may suggest investors expect high future growth, while a low P/E ratio might indicate a potentially undervalued stock.
- Share: A unit of ownership in a company. When you buy shares, you become a part-owner of that company.
- Stock Exchange: An organized marketplace where stocks and other securities are bought and sold. Examples include the New York Stock Exchange (NYSE) and the Nasdaq.
- Volatility: A measure of how much the price of a security fluctuates. High volatility means the price changes rapidly and dramatically, while low volatility indicates more stable price movements. Volatility is often expressed as a percentage or standard deviation.
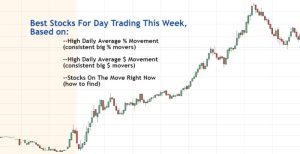
Exploring Stock Market Data and Charts
Understanding stock market charts is crucial for making informed trading decisions. Charts visually represent price movements over time, providing insights into trends, momentum, and potential support and resistance levels. Learning to interpret these charts effectively empowers you to identify potential buying and selling opportunities and manage risk more effectively.Stock charts display a variety of data points, primarily price (open, high, low, close) and volume.
These data points, when plotted over time, create patterns that technical analysts study to predict future price movements. While not a guarantee of future performance, technical analysis, using charts, can significantly enhance your trading strategy.
Interpreting Stock Charts and Key Indicators
Stock charts typically display price data on the vertical axis and time on the horizontal axis. Simple line charts show the closing price over time, while candlestick charts provide more detailed information including open, high, low, and closing prices for each period (e.g., daily, weekly). Key indicators like moving averages (e.g., 50-day, 200-day) help smooth out price fluctuations and identify trends.
Relative Strength Index (RSI) measures momentum, indicating overbought or oversold conditions. Volume data provides context to price movements; high volume confirms a trend, while low volume suggests weakness.
Significance of Chart Patterns
Certain recurring patterns on stock charts can signal potential price movements. A “head and shoulders” pattern, for example, is a bearish reversal pattern, suggesting a potential price decline after a period of upward movement. The “head” represents a peak, followed by two smaller “shoulders,” indicating weakening momentum. Conversely, an “inverse head and shoulders” pattern is bullish, suggesting a potential price increase.
Triangles, another common pattern, can indicate consolidation before a breakout in either direction. The type of triangle (ascending, descending, symmetrical) provides clues about the potential direction of the breakout.
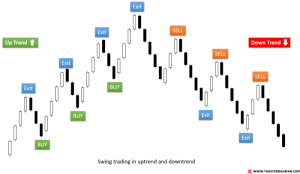
Using Technical Analysis to Inform Trading Decisions
Technical analysis uses chart patterns and indicators to predict future price movements. For example, a bullish crossover occurs when a short-term moving average crosses above a long-term moving average, suggesting a potential upward trend. Conversely, a bearish crossover signals a potential downward trend. RSI values above 70 generally indicate an overbought market, suggesting a potential price correction, while values below 30 suggest an oversold market, potentially indicating a price rebound.
However, it’s crucial to remember that technical analysis should be used in conjunction with fundamental analysis and risk management strategies. Relying solely on technical analysis can be risky.
Using Candlestick Charts to Identify Opportunities
Candlestick charts offer a rich visual representation of price action. A “bullish candlestick” (green or white) indicates that the closing price was higher than the opening price, suggesting buying pressure. A “bearish candlestick” (red or black) shows the closing price was lower than the opening price, indicating selling pressure. Specific candlestick patterns, such as “hammer” or “doji,” can signal potential reversals or periods of indecision.
For instance, a hammer candlestick at the bottom of a downtrend can suggest a potential bottom and a subsequent price increase. However, it is important to analyze candlestick patterns within the broader context of the overall market trend and other technical indicators. Confirmation from other indicators strengthens the signal.
Investing in the stock market is a journey of learning and growth. While this guide provides a strong foundation, remember that continuous learning and adaptation are key. Stay updated on market trends, refine your strategies, and don’t hesitate to seek professional advice when needed. With careful planning, diligent research, and a measured approach, you can navigate the complexities of the stock market and achieve your financial goals.
Expert Answers
What is the minimum amount I need to start investing in the stock market?
Many brokerage platforms allow you to start investing with very little money, even as little as a few dollars for fractional shares. However, it’s important to consider your investment goals and risk tolerance before investing any amount.
How often should I check my investments?
The frequency with which you check your investments depends on your investment strategy and personal preference. Some investors check daily, while others prefer a less frequent approach. Regular monitoring can be helpful, but excessive checking can lead to emotional decision-making.
What are the tax implications of stock market investments?
Tax implications vary depending on your location and the type of investment. Capital gains taxes are typically applied to profits from selling stocks. Consult a tax professional for personalized advice.
How do I choose a brokerage account?
Consider factors such as fees, available investment options, research tools, and customer support when selecting a brokerage account. Compare different platforms to find one that best suits your needs and experience level.