Navigating the world of stock trading can feel daunting, but understanding how to read stock charts is the key to unlocking its potential. This guide demystifies the process, taking you from novice to informed investor. We’ll explore various chart types, candlestick patterns, key indicators, and volume analysis, providing you with the tools to interpret market trends and make more confident investment decisions.
From the basics of line charts to the intricacies of MACD indicators, we’ll break down complex concepts into easily digestible steps. Learn to identify support and resistance levels, understand bullish and bearish patterns, and ultimately, develop a sharper eye for spotting profitable opportunities. This journey will equip you with the fundamental skills to navigate the dynamic landscape of the stock market with greater confidence and understanding.
Stock Market, Stock Options, and Stock Trading Overview
The stock market is a complex system facilitating the buying and selling of company shares, allowing investors to participate in the growth and profitability of publicly traded businesses. Understanding its structure and function, along with the various trading instruments and strategies available, is crucial for navigating this dynamic environment. This section will provide a foundational overview of the stock market, stock options, and common trading approaches.
Stock Market Structure and Function
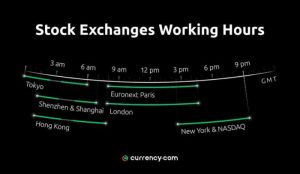
The stock market is comprised of various exchanges where buyers and sellers connect to trade securities. Prominent examples include the New York Stock Exchange (NYSE), known for its traditional floor-based trading, and the NASDAQ, a primarily electronic exchange specializing in technology stocks. These exchanges provide a regulated marketplace, ensuring transparency and fair trading practices. The overall function is to facilitate capital formation for companies needing funding and provide investors with opportunities to generate returns through capital appreciation and dividends.
Price discovery, the process of determining a fair market price through supply and demand, is a core function of the stock market. Investors utilize various tools and analyses to assess the value of stocks and make informed trading decisions.
Stock Options: Calls and Puts
Stock options are contracts that grant the buyer the right, but not the obligation, to buy (call option) or sell (put option) a specific number of shares of an underlying stock at a predetermined price (strike price) on or before a specific date (expiration date). Call options are purchased when an investor anticipates the price of the underlying stock will rise, allowing them to buy at a lower price and sell at a higher price.
Put options, conversely, are purchased when an investor believes the price will fall, providing the right to sell at a higher price than the market value. Option pricing is influenced by several factors, including the underlying stock price, volatility, time to expiration, interest rates, and the strike price itself. The Black-Scholes model is a widely used, though not perfect, method for estimating option prices.
Stock Trading Strategies
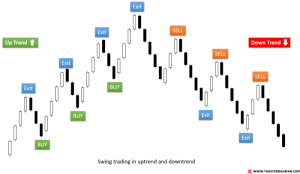
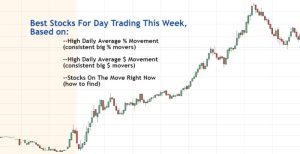
Several distinct strategies exist for trading stocks, each with its own risk profile and potential rewards.Day trading involves buying and selling stocks within the same trading day, aiming to profit from short-term price fluctuations. This strategy demands significant market knowledge, technical analysis skills, and risk tolerance due to its inherent volatility.Swing trading focuses on capturing price movements over a few days or weeks.
Swing traders identify short-to-medium-term trends and hold positions for longer periods than day traders, mitigating some of the inherent risk.Value investing is a long-term strategy focusing on identifying undervalued companies with strong fundamentals. Value investors analyze financial statements and company performance to find stocks trading below their intrinsic worth, expecting price appreciation over the long term. This strategy requires patience and a deep understanding of financial analysis.The choice of strategy depends on an investor’s risk tolerance, time horizon, and investment goals.
Day trading offers the potential for high returns but carries substantial risk, while value investing offers lower risk but potentially slower returns. Swing trading sits somewhere in between, offering a balance of risk and reward.
Mastering the art of reading stock charts is a continuous process, demanding practice and observation. However, by grasping the fundamental concepts explored in this guide – understanding chart types, interpreting candlestick patterns, utilizing key indicators, and analyzing volume – you’ve laid a solid foundation for informed decision-making. Remember, consistent learning and practical application are crucial to honing your skills and ultimately achieving your investment goals.
The stock market remains a dynamic and challenging environment, but with the right knowledge, you can confidently navigate its complexities.
Frequently Asked Questions
What are the best resources for practicing chart reading?
Many online brokers offer charting tools and historical data. Websites dedicated to financial education also provide practice charts and tutorials. Consider using simulated trading platforms to practice without risking real capital.
How often should I review stock charts?
The frequency depends on your trading style. Day traders review charts constantly, while long-term investors may check them weekly or monthly. Establish a schedule that aligns with your investment strategy.
What is the difference between fundamental and technical analysis?
Fundamental analysis focuses on a company’s financial health and intrinsic value, while technical analysis uses price charts and indicators to predict future price movements. Both approaches can be valuable but often complement each other.
Are there any free tools available for charting?
Yes, many websites and online brokers offer free charting tools with basic features. However, more advanced features often require subscriptions.